
Discord Community Analytics: How to Track What Actually Matters

Most brand Discord communities are managed on instinct. The team knows something is off when engagement drops, but they cannot say why. They know a particular event went well, but they cannot replicate the conditions. They report member count to leadership because it is the only number they have.
Community analytics changes this. When you instrument a Discord server correctly, you move from reacting to what you see to predicting what will happen next — and adjusting before problems compound. This guide covers the analytics framework, the tools available, and how to build a reporting system that produces actionable insight rather than vanity data.
What Discord Community Analytics Actually Measures

Discord analytics is not a single dashboard — it is a stack of data sources that together paint a picture of community health. Understanding what each source measures and what it cannot tell you is the starting point for building useful analytics.
Discord Native Insights
Discord's built-in Server Insights (available to servers with 500+ members) provides basic aggregate data: member count over time, message volume by channel, visitor-to-member conversion rate, and retention at 1, 7, and 28 days. This is your baseline — free, always on, and sufficient for early-stage communities.
The limitation is that native insights are aggregate and backward-looking. They tell you what happened but offer limited ability to segment by member type, track individual member journeys, or connect Discord behavior to external business data.
Bot-Generated Data
Purpose-built Discord bots extend analytics significantly. A well-configured analytics bot tracks message frequency by member and channel, role progression rates, event attendance, referral attribution, and member activity patterns over time. This is where community analytics becomes genuinely useful for brand decision-making.
Qualitative Signals
Quantitative data tells you what is happening. Qualitative signals tell you why. Regular manual review of conversation themes, sentiment shifts, and recurring questions is a necessary complement to numerical metrics — and increasingly, AI summarization tools can surface these patterns automatically from high-volume servers.
The Community Analytics Stack: What to Track and When
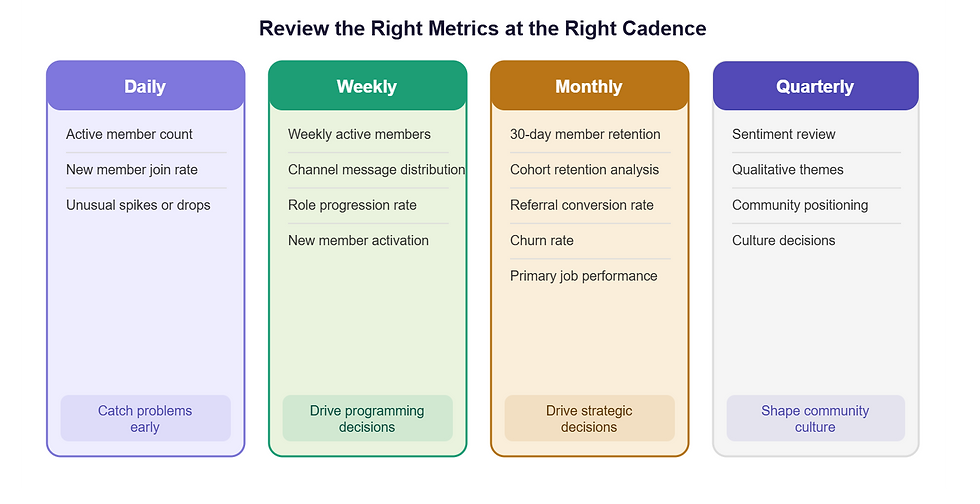
Different metrics operate on different time horizons. Checking the wrong metrics at the wrong cadence wastes analytical energy on noise.
Metric | Review cadence | What action it drives |
|---|---|---|
Daily active members | Daily | Identify unusual drops or spikes requiring investigation |
New member join rate | Daily | Monitor growth trajectory and campaign effectiveness |
Weekly active members | Weekly | Core engagement health indicator |
Channel message distribution | Weekly | Identify underperforming or overloaded channels |
Role progression rate | Weekly | Monitor whether progression system is functioning |
Event attendance rate | Per event | Evaluate event format and timing decisions |
30-day member retention | Monthly | Primary onboarding effectiveness indicator |
Churn rate (members leaving) | Monthly | Flag structural community health issues |
Referral conversion rate | Monthly | Evaluate referral program performance |
Sentiment trend | Monthly | Identify cultural or content issues before they escalate |
The Five Most Important Community Health Indicators
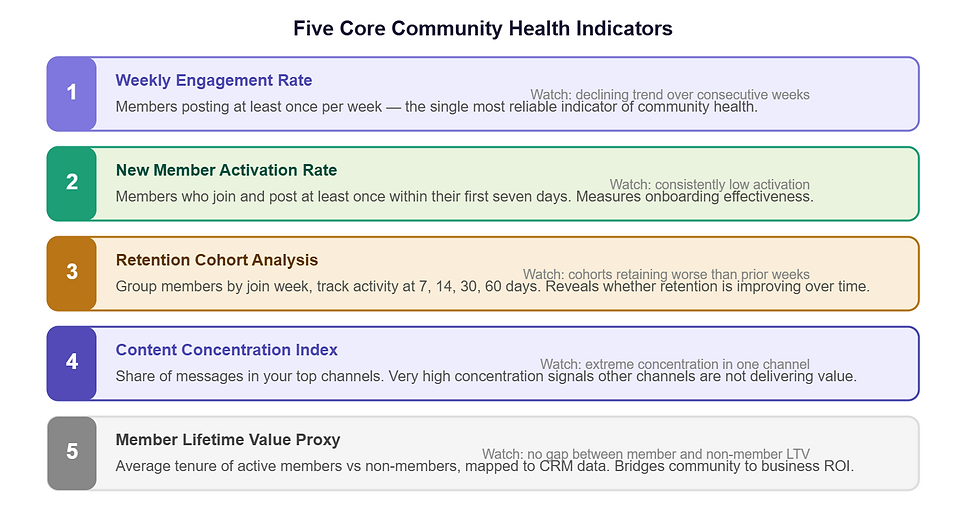
If you can only track five things, track these. Together they give you an accurate picture of whether your community is healthy, growing, and delivering value.
1. Weekly Engagement Rate
The percentage of total members who send at least one message in a given week. This is the single most reliable indicator of community health because it filters out dormant accounts and measures actual participation.
Target: 10–25% for brand communities. Below 10% signals a content or programming problem. Above 25% indicates a highly engaged community. Calculate weekly and track the trend — a declining trend over four consecutive weeks is an early warning signal worth investigating immediately.
2. New Member Activation Rate
The percentage of members who join in a given week and post at least once within their first seven days. This measures onboarding effectiveness directly.
Target: above 40%. Below 25% indicates your onboarding flow is not converting new joins into participants. This metric should be reviewed weekly for the first three months after any change to the onboarding process.
3. Retention Cohort Analysis
Group members by their join week and track what percentage of each cohort is still active at 7, 14, 30, and 60 days. Cohort analysis reveals whether retention is improving or declining over time, and whether specific join periods (after a product launch, a campaign, or a referral push) produce members who retain differently.
This is the analytics layer that most communities skip because it requires more sophisticated tracking — but it is also the layer that produces the most actionable insight for community strategy.
4. Content Concentration Index
The percentage of total messages that occur in your top three channels. High concentration (above 70%) in a few channels suggests either that other channels are not delivering value or that your channel architecture needs reorganization.
The insight this metric provides: channels where members are not talking are channels that should either be given a clearer purpose or archived. A high concentration index is often the first signal that your server structure needs adjustment.
5. Member Lifetime Value Proxy
For communities connected to a product, track the average tenure of active community members versus non-members, and map this to customer lifetime value data from your CRM. This is the bridge between community analytics and business ROI — and it is what transforms a community report from an engagement summary into a revenue conversation.
AI-Powered Analytics: What Is Now Possible
In 2026, AI summarization and analysis tools have changed what is practically achievable for community analytics teams without data science resources.
Conversation summarization: AI tools can process thousands of messages per day and produce a structured summary of top topics, recurring questions, and sentiment signals — eliminating the need for manual channel review at scale.
Churn prediction: behavioral patterns that precede member inactivity — declining message frequency, reduced event attendance, shorter response times — can be identified by machine learning models before the member actually leaves, enabling proactive re-engagement.
Feedback extraction: AI can systematically identify product feedback, feature requests, and bug reports from conversational messages, categorize them, and surface them to the relevant team — turning community conversation into structured product intelligence.
Sentiment tracking: automated sentiment analysis across channels provides a continuous read on community mood, flagging shifts that might not be visible from quantitative metrics alone.
These capabilities are increasingly available through purpose-built Discord community management platforms rather than requiring custom development.
How to Build a Community Analytics Report
A useful analytics report does three things: tells you the current state of community health, explains why it is in that state, and identifies what to do next. A report that only describes numbers without connecting them to decisions is analytics theater.
Monthly community analytics report structure:
Health summary: three to four top-line numbers (weekly active rate, 30-day retention, new member activation rate, total active members) with brief trend commentary.
Primary job performance: the two metrics most directly tied to the community's primary job — churn delta for Retention Engine, ticket deflection for Support Hub, referral conversion for Growth Channel.
Top insight from qualitative review: one specific theme, question, or piece of feedback that emerged from conversation analysis this month.
What changed: any experiments, events, or structural changes made this month and their measured impact.
Next month focus: one specific thing to test or improve, with the metric that will tell you whether it worked.
FAQ
What analytics tools are available for Discord communities?
Discord's native Server Insights provides basic aggregate data for servers with 500 or more members. Beyond that, purpose-built Discord analytics bots track member-level behavioral data, role progression, referral attribution, and event attendance. For brand communities that need to connect Discord data to CRM or revenue data, integrations between Discord bots and business intelligence tools provide the most complete picture.
How do you measure community health on Discord?
The five most reliable community health indicators are weekly engagement rate (target 10–25% of members), new member activation rate (target above 40%), 30-day member retention, content concentration index, and member lifetime value proxy relative to non-members. Together these metrics identify whether the community is growing, retaining, and producing business value — not just whether it is busy.
What is a good Discord retention rate for a brand community?
A 30-day retention rate above 20% is the baseline for a healthy brand Discord community. Above 35% indicates strong onboarding and programming. Below 15% suggests a structural problem — either the community is attracting the wrong members, the onboarding is failing to convert joins into participants, or the ongoing programming is not providing sufficient value to sustain engagement.
How often should you review Discord community analytics?
Daily monitoring of join rate and active member count catches unusual spikes or drops that require immediate investigation. Weekly review of engagement rate, channel distribution, and role progression informs programming decisions. Monthly cohort retention analysis and primary job performance metrics drive strategic decisions. Quarterly sentiment and qualitative review shapes community culture and positioning decisions.
The Bottom Line
Community analytics is not about having more data — it is about having the right data reviewed at the right cadence and connected to decisions. Most community teams that struggle with analytics are not lacking information; they are lacking a framework for turning information into action.
Start with the five core health indicators. Build the weekly and monthly review cadence before adding complexity. Connect community metrics to business outcomes as early as possible. And use the insight the community gives you — not just to report on the community, but to make it better.


Comments